Evaluating & Monitoring Our Progress
To be successful in eliminating traffic fatalities, it’s critical to know where, when and why collisions, crashes, or injuries and deaths are happening and to respond to the most recent incidents and trends. The City has developed innovative tools to improve our understanding of street safety and build responsiveness into the system.
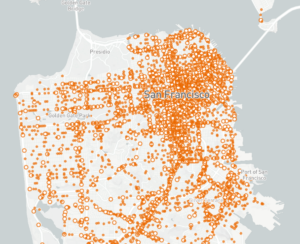
Traffic Crashes Dataset
Updated Traffic Crashes Data can be found at DataSF. This table contains all crashes resulting in an injury in the City and County of San Francisco. After review by SFPD and SFDPH staff, the data is made publicly available approximately a month after the end of the previous quarter (May for Q1, August for Q2, November for Q3, and February for Q4).
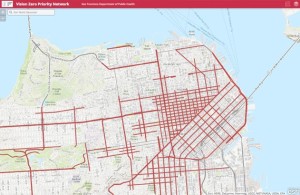
High Injury Network Map
In San Francisco, 68 percent of severe and fatal traffic injuries occur on just 12 percent of city streets. Through Vision Zero SF, the City has used years of data to identify where the most investments in engineering, education and enforcement should be focused to have the biggest impact in reducing fatalities and severe injuries.
Complete Injury & Fatality Reporting
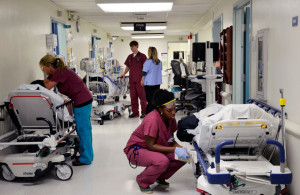
A significant number of pedestrian and cyclist injuries are not captured in police data, creating an incomplete picture of street safety. The San Francisco General Hospital and Trauma Center is working with city partners to develop a comprehensive system to ensure accurate, coordinated and timely monitoring of injuries and fatalities for safety project prioritization, evaluation, and reporting.


